Bridges Math Art Conference Seoul – Part 2

I have just returned from an amazing visit to Seoul to participate in the Bridges Conference. Bridges is an international organization that promotes the connections between Mathematics and Art, Music, Architecture, and Culture. This year the conference was a satellite conference for the huge International Congress of Mathematicians that took place in Seoul during the same week. This proximity enhanced our events by bringing numerous renowned Mathematicians (including Fields Medal winner Cedric Villani) to speak at the Bridges conference. One of the highlights of this conference is always the Art Exhibition. There was so much exciting work on display but I will only be able to discuss a small percentage in my blog.

Gary Greenfield

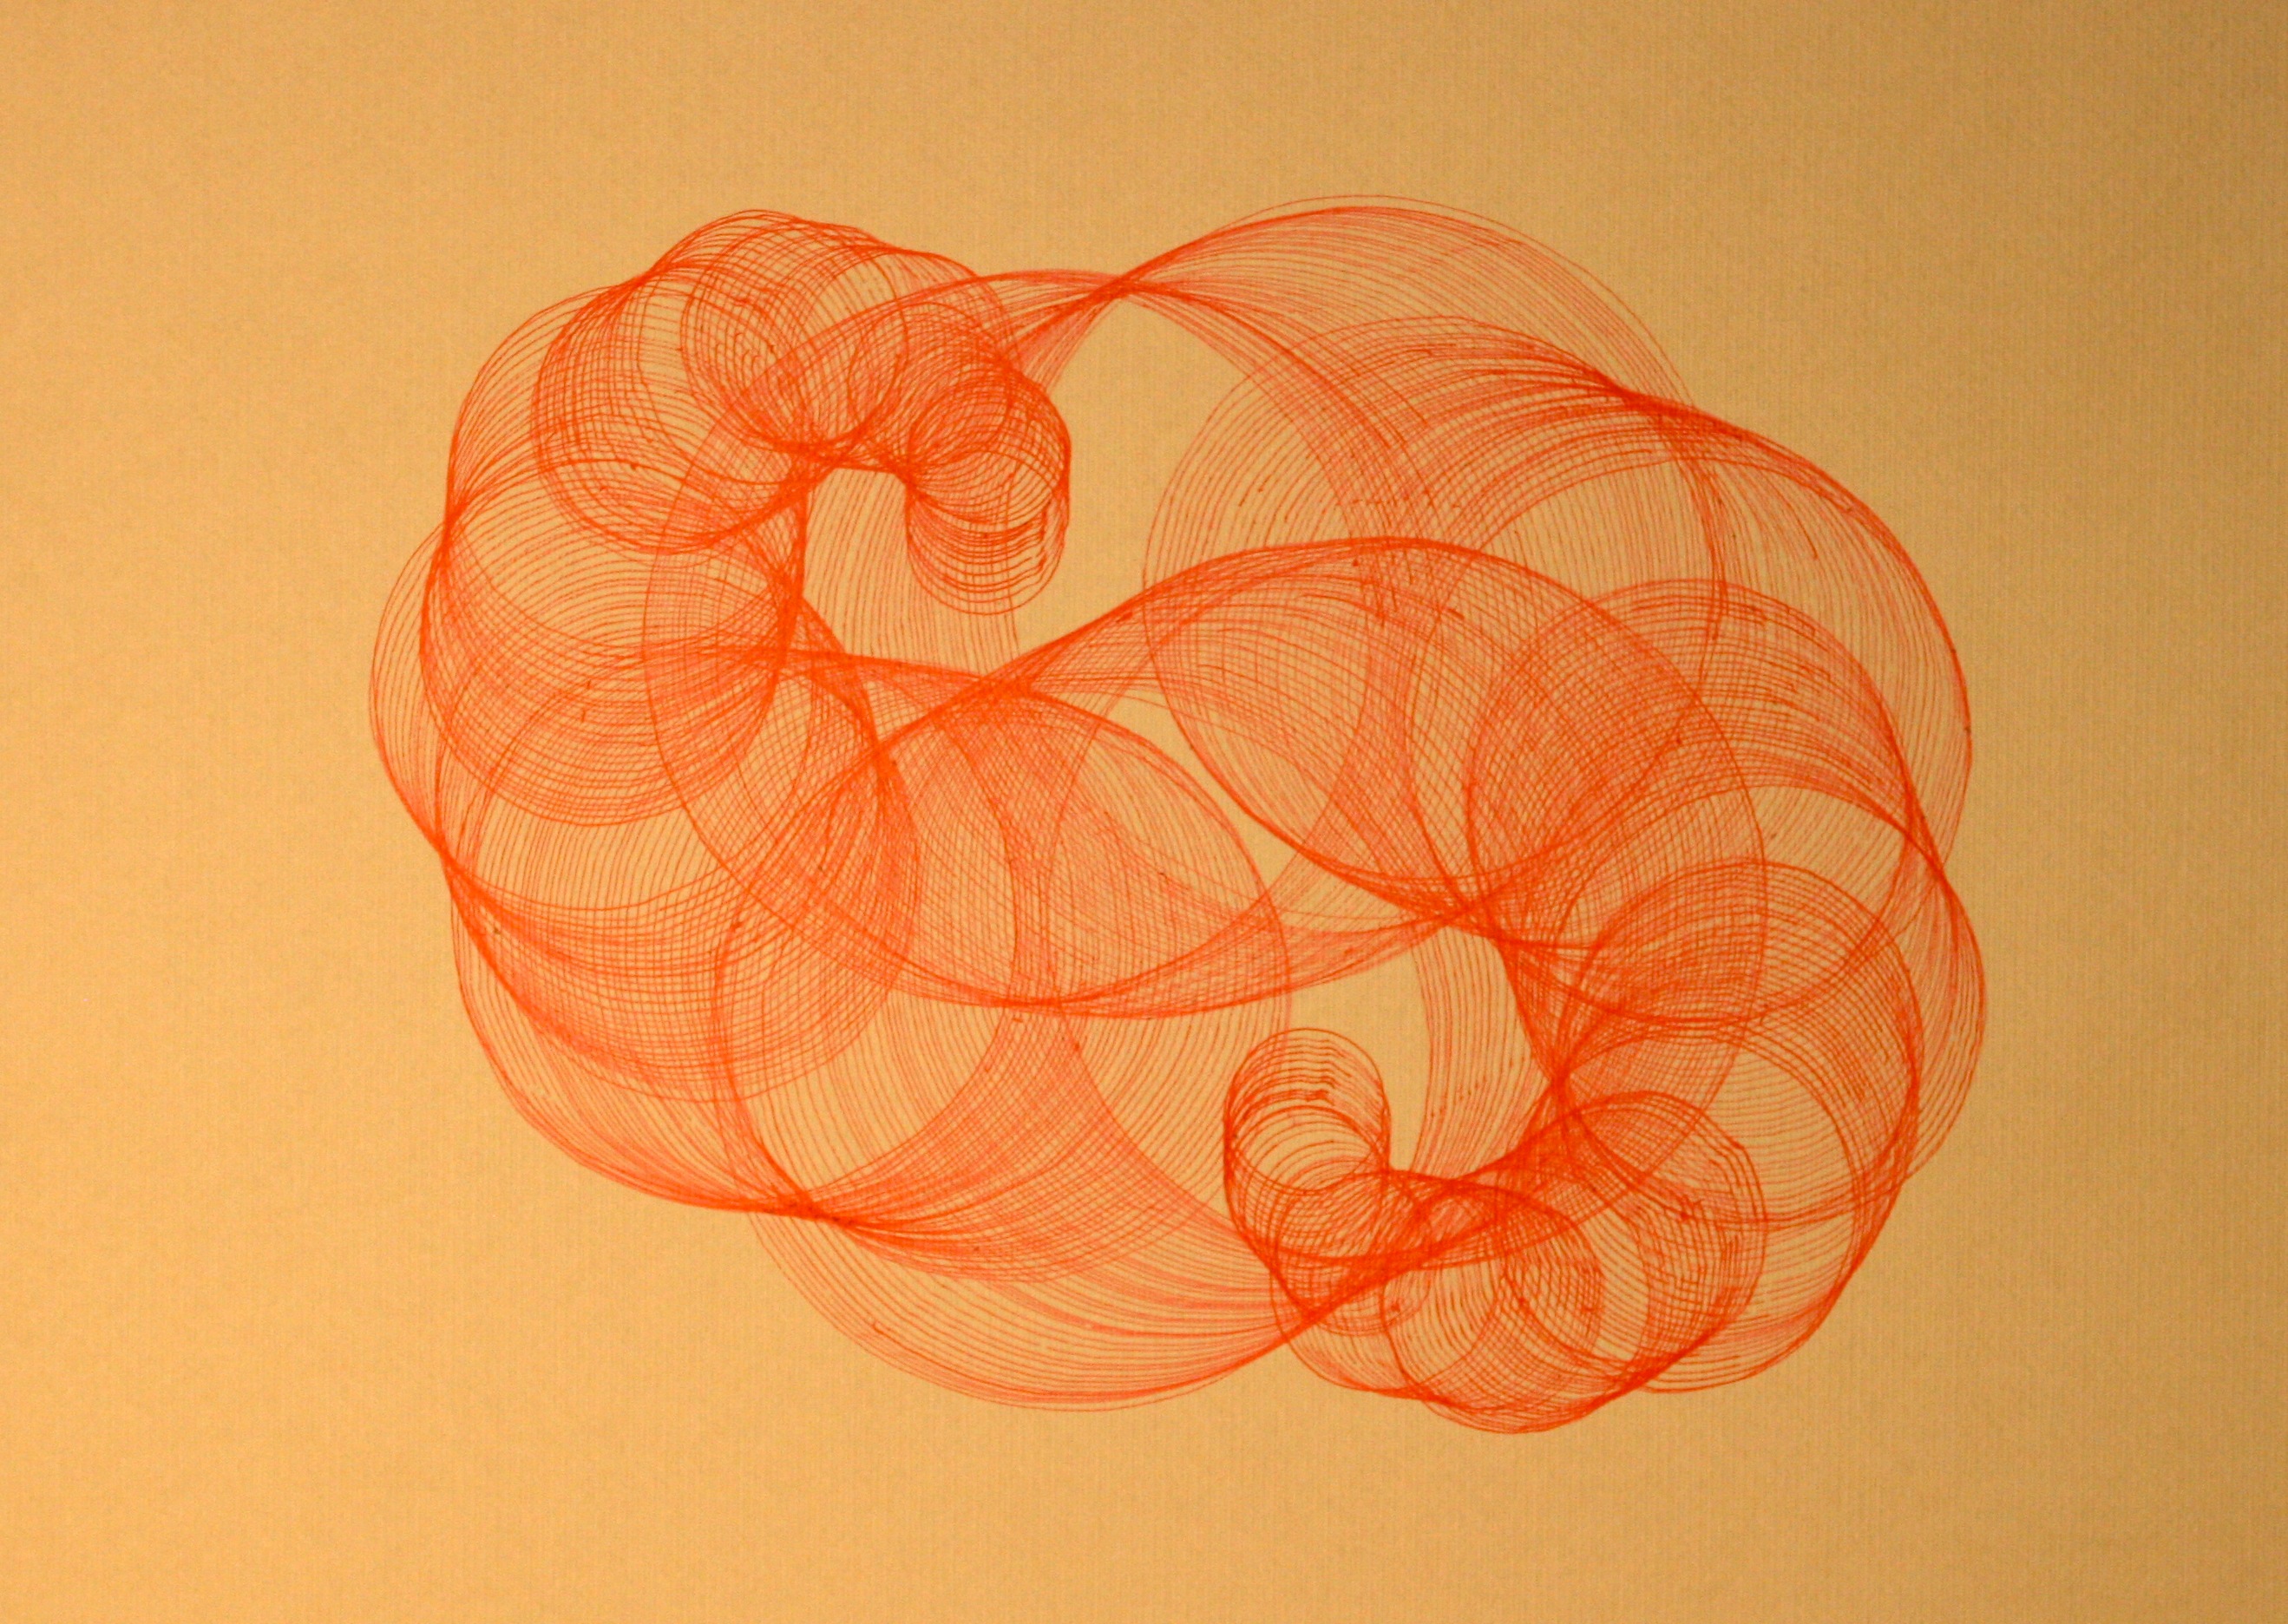
There is a type of computer assisted painting referred to as Ant Paintings in which points of pigment are deposited on a surface using an algorithm that determines when the pigment is picked up, where it is carried and where it is dropped. This process of “mobile automata” mimics the natural behavior of ants moving grains of sand. The completed paintings have an organic quality. Gary Greenfield has created a new series of work using this technique. He is the first artist to explore the incorporation of formulae into the algorithms in such a way that geometric shapes are formed in the painting.

40-1

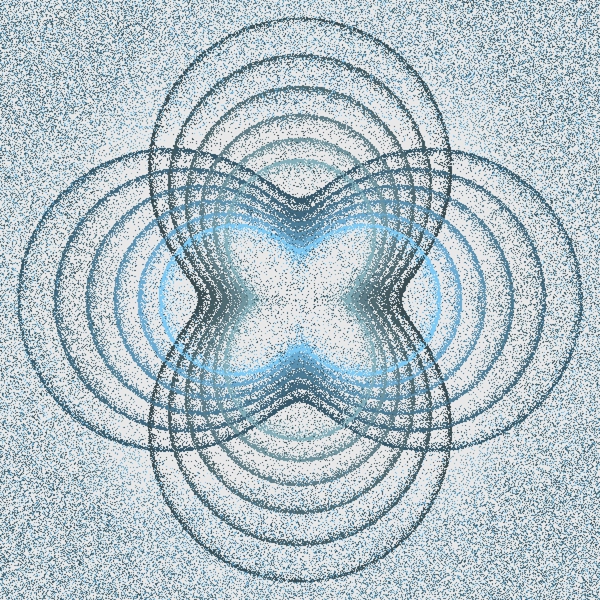
PCD #11863 – 6″ x 6″ – Digital Print – 2014
Picture courtesy of the artist

In the digital print “PCD #11863”, Greenfield starts the process with uniformly distributed grains of pigment. Then the virtual ants are instructed to carry and deposit the color on to twelve polar curves. Polar curves are curves drawn using the polar coordinate system. This is  a 2-D coordinate system like the Cartesian coordinate system, but instead of having two axis to define the placement of a point on the plane, the Polar Coordinate system uses a single fixed point, an angle from a fixed direction, and the distance from the initial point, to determine the placement of the point. For this particular painting Greenfield used the formula

daum_equation_1409057425549 
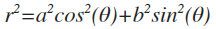
to determine where the pigment would be distributed  The resulting image has order four rotational symmetry and a graceful use of concentric shapes, but what makes this work unique to me is its organic quality.
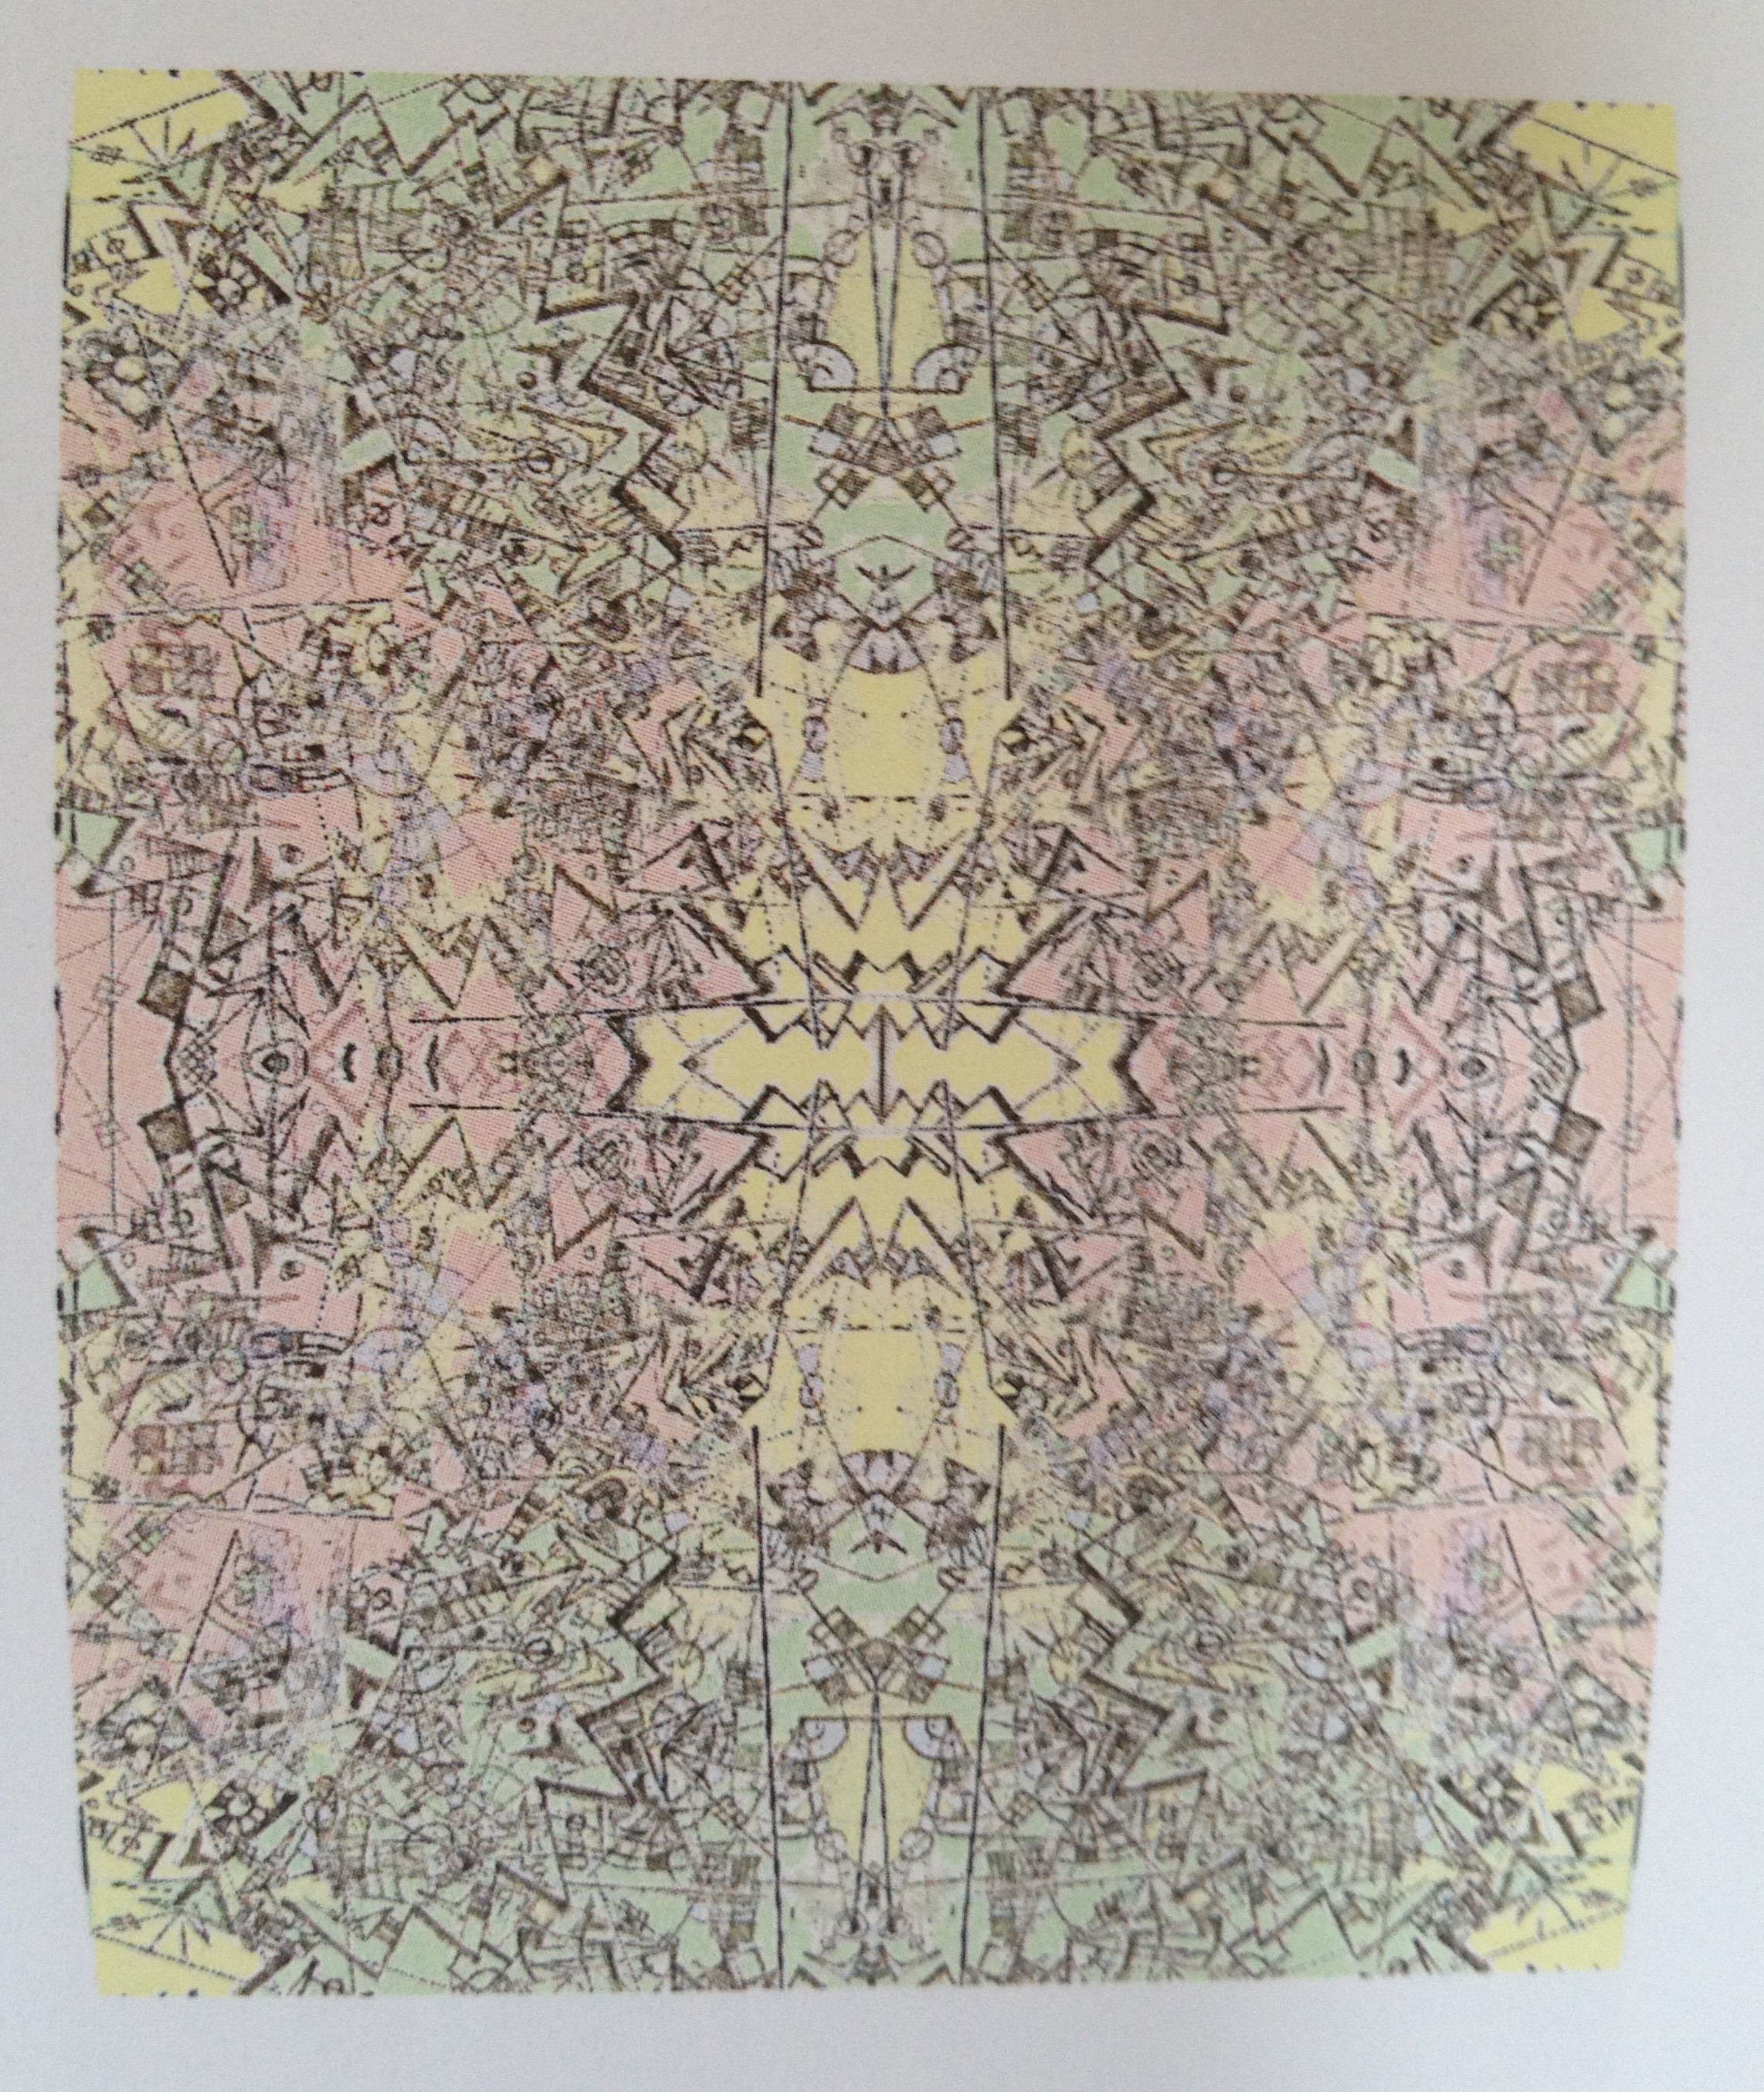
David Reimann

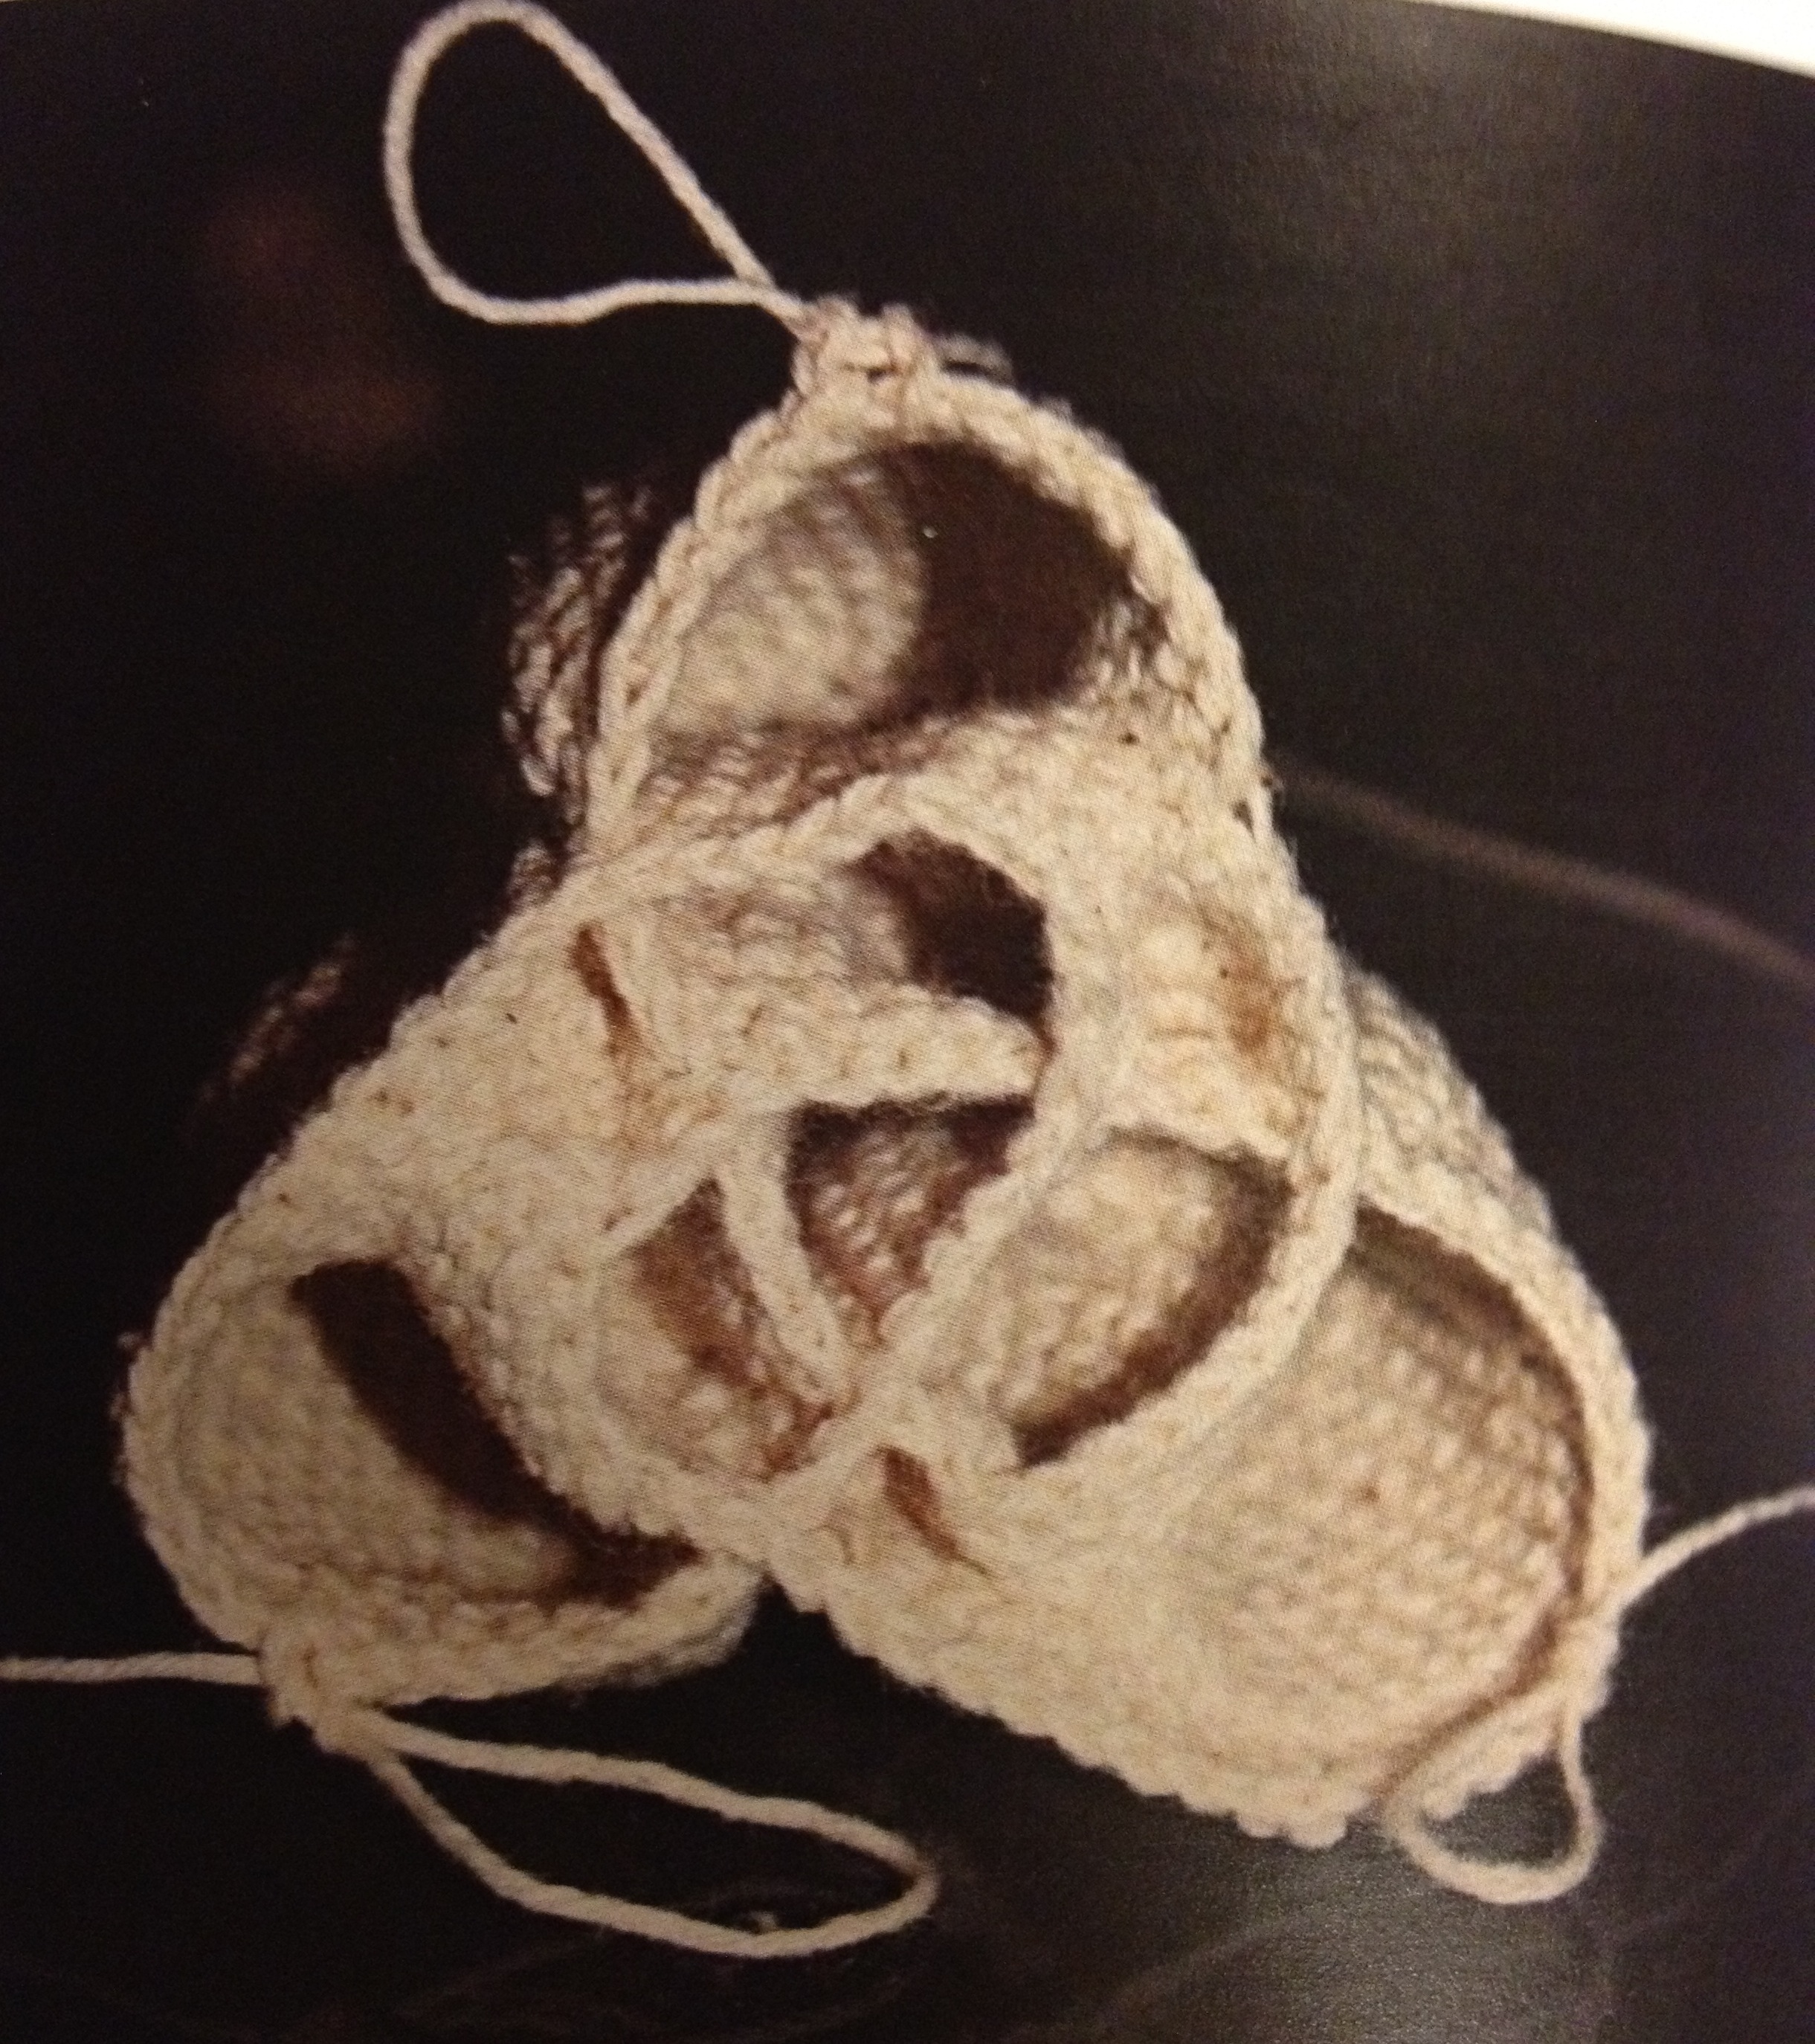
There was one sculpture in the exhibition that I felt was a great visual representation of the whole conference. “Mathematics is Universal” is a wooden dodecahedral form by David Reimann.

universal

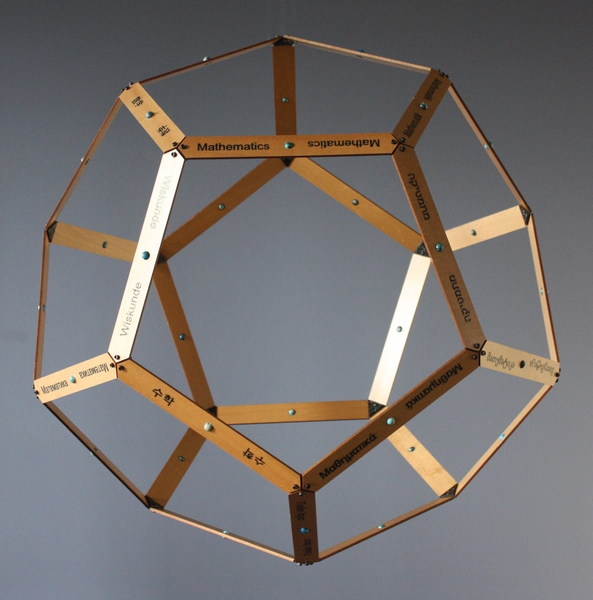
Mathematics is Universal – 23 in x 23 in x 23 – Mixed media sculpture – 2014
Picture courtesy of the artist

A regular dodecahedron is comprised of 12 regular pentagons (regular means all sides have the same measure),  and 30 edges. The sculpture “Mathematics features the 30 edges of the dodecahedral form made out of wood strips. Each of the 30 strips has the word mathematics hand-painted in a different language. I feel this sculpture is a perfect metaphor for our conference. People from many cultures gathering to discuss the beauty and form of Mathematics.

Suman Vaze

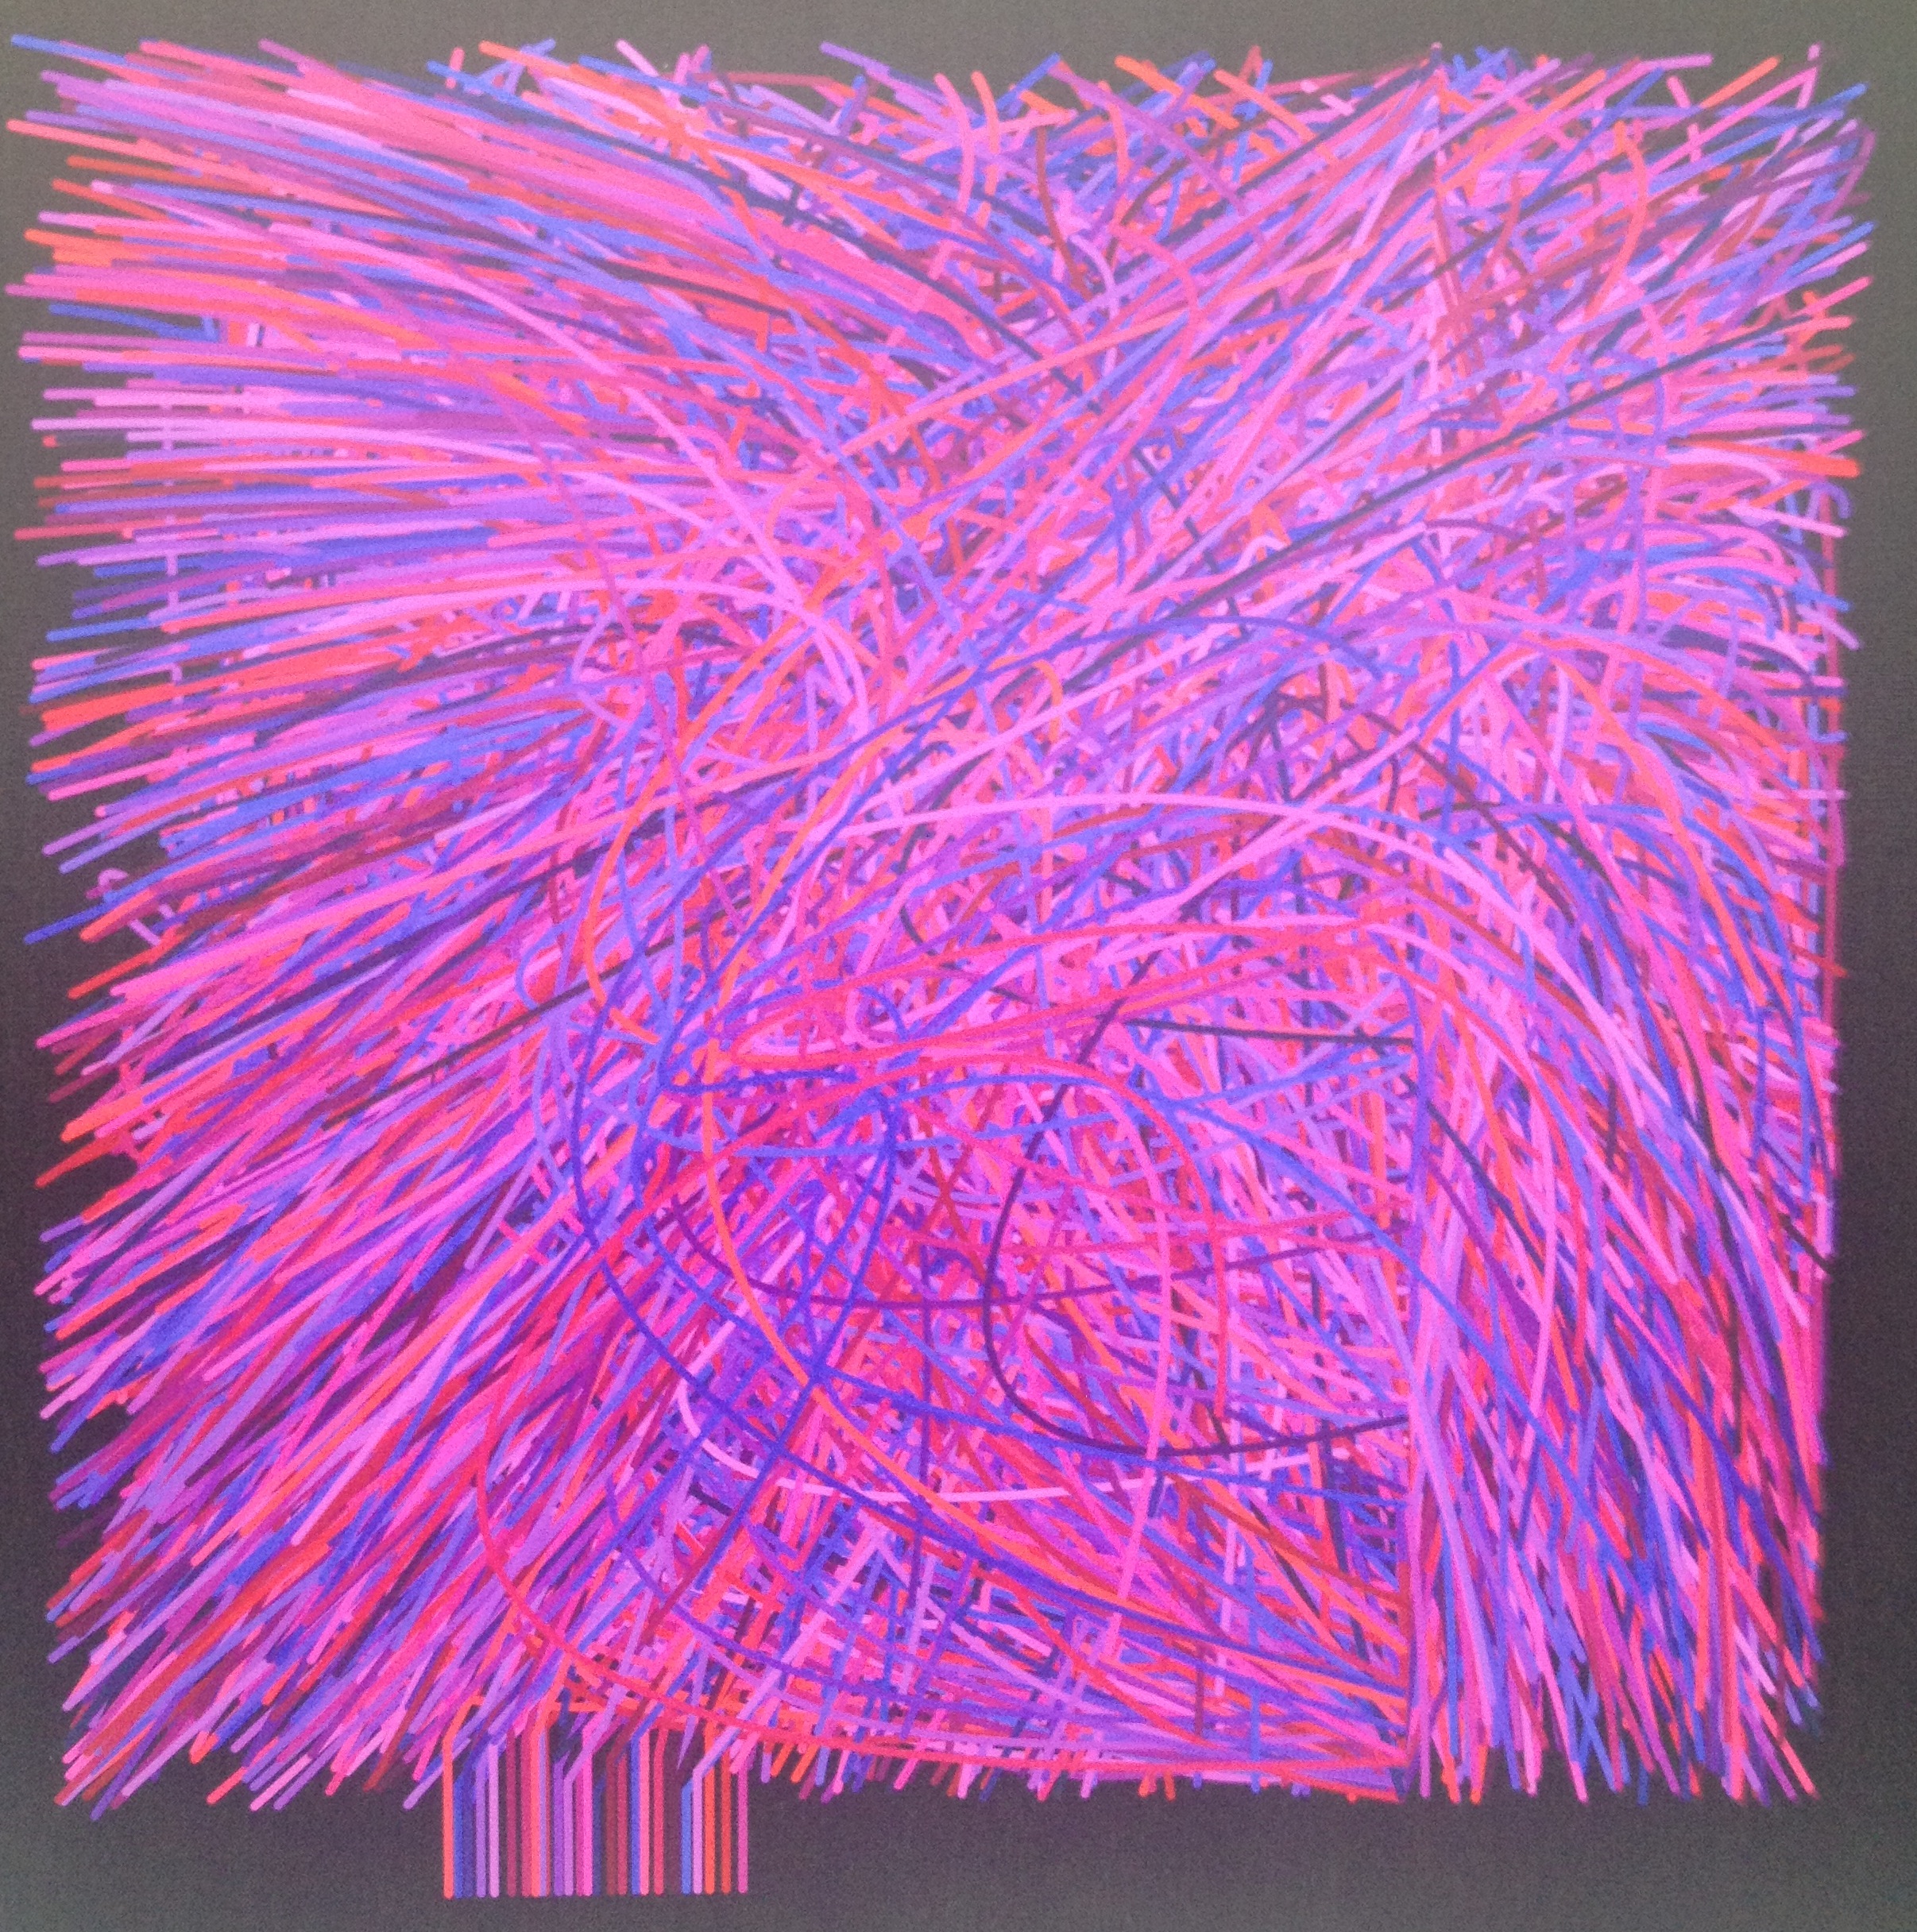
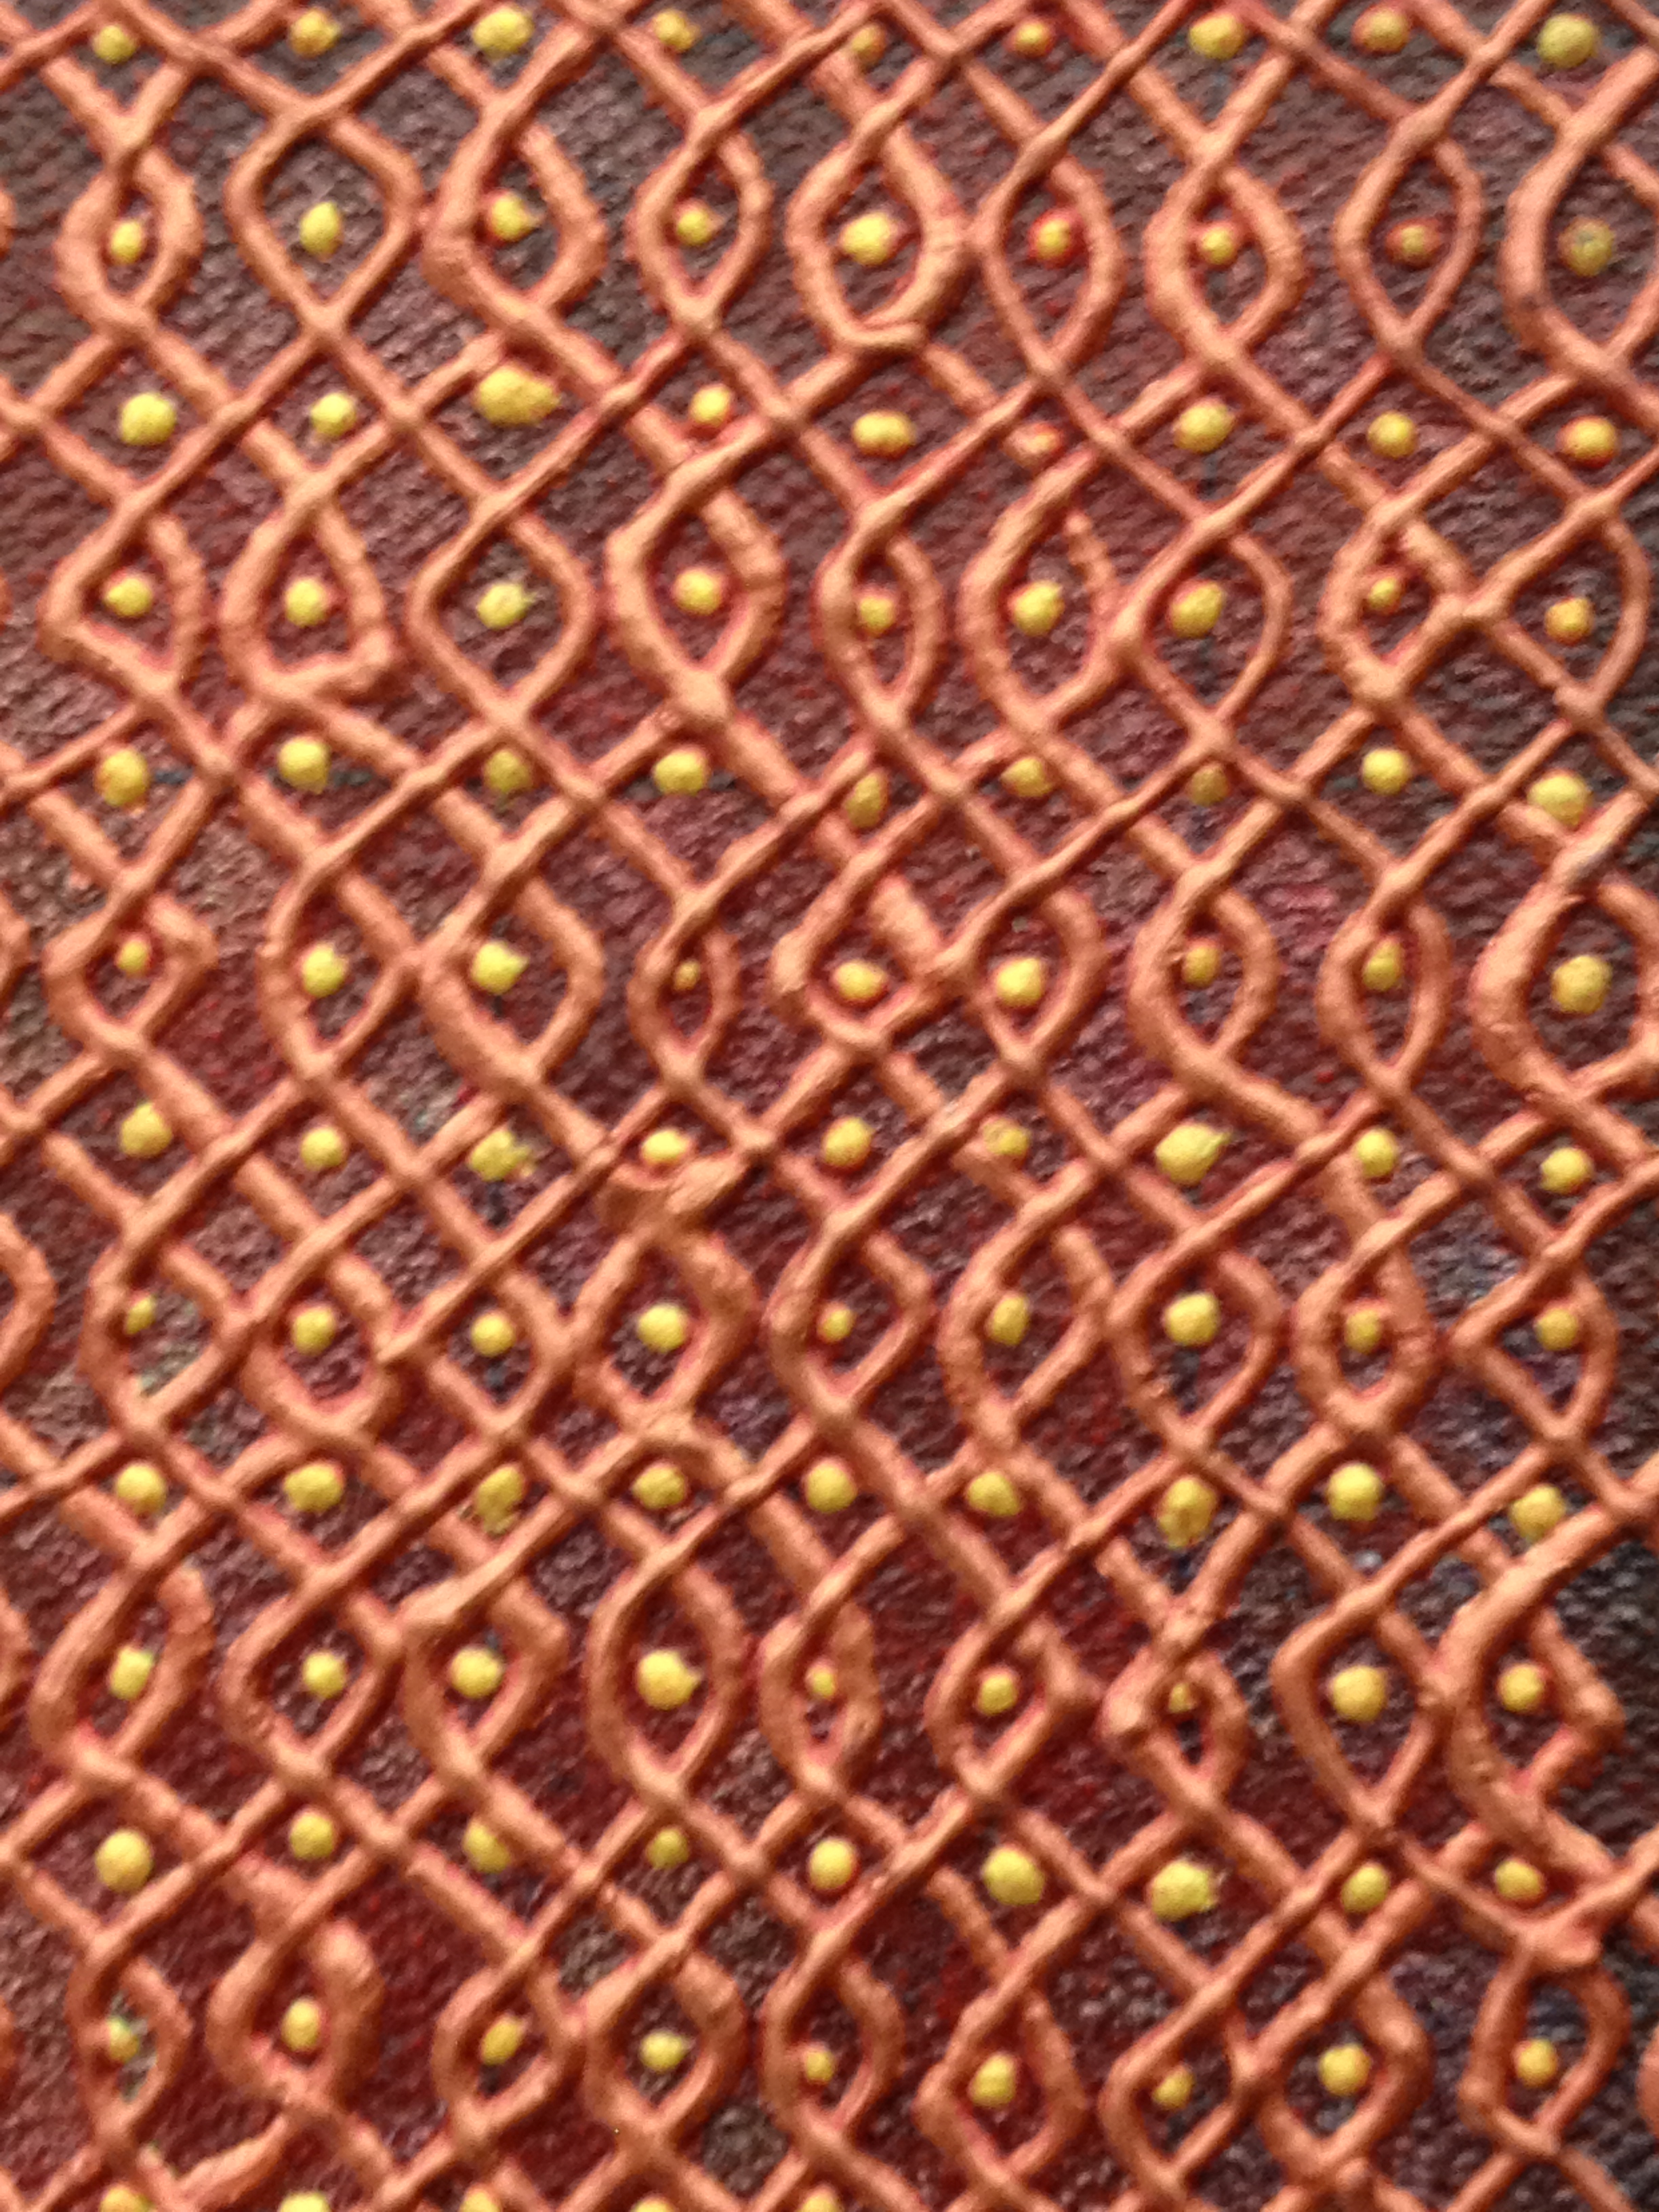
Some of the most abstract and gestural art on view was by the painter Suman Vaze. Her canvas “Ryoanji III” is an expression of the balance found in a 4 by 4 magic square. It is divided into a 4 by 4 invisible grid, and the number of horizontal and vertical lines going through a section of the canvas represents the number that would go in the corresponding square of the magic square.

cimg0559

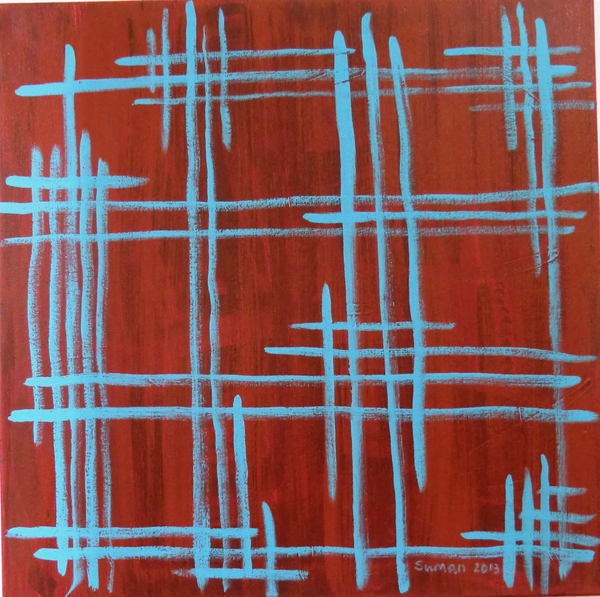
Ryoanji III – 24″ x 24″ – acrylic on canvas – 2013
Picture courtesy of the artist

The particular magic square Vaze selected to depict in “Ryoanji III” is particularly well balanced each row and column adds up to 34 but each 2 by 2 square also adds up to 34. A nice Fibonacci number!

These are just a few of the interesting works on display at Bridges. I will tell you about some more in my next post!

Susan Happersett

Chaos – The Movie

It is my personal mission as an artist to illuminate the intrinsic beauty of mathematics in a purely aesthetic realm. Translating mathematical subject matter to the picture plane of my drawings, I strive to enable viewers to appreciate this aesthetic, regardless of their mathematical background. I express the grace and beauty I find in mathematics through symmetries, patterns and proportions in my art. Many of my drawings are related to growth patterns such as the Fibonacci sequence and binary growth. I begin my work process by creating a plan or an algorithm. I make all of the decisions for the work beforehand and make a detailed plan in a large spiral drawing tablet that I refer to as my plan book. After I write out all of the specifications, I generate the actual drawing by hand using the rules from the plan. Through my drawings I hope to express both the aesthetics of my mathematical subject matter, as well as the aesthetics of the process of algorithmic generation.

In the past few years I have become interested in generating drawings using fractal forms based on the repetition of similar shapes. I begin with a largest instance of a shape and incorporate copies scaled by powers of ½. I developed a drawing based on the four quadrants of the Cartesian coordinate system. Each drawing begins with 8 spokes. The line segments fall on the coordinate axes and the lines y=x and y=-x. Once I have drawn the initial shape, each spoke becomes the starting point for a new 8-spoke shape in which the line segments are ½ as long as the original spokes. Then those 64 spokes become the starting point for 8-spoke figures with line segments ¼ the length of the first line segments. Next, the 512 spokes each become the bases for an 8-spoke shape with line segments 1/8 the length of the original spokes. This process creates a circular fractal network of lines. While producing these drawings, I have developed a type of mantra to remember where I am in the drawing. I need to keep count and this becomes quite complicated and rhythmic, especially when I reach the third iteration.

Mathematics and art both enable humans to better understand the world around them by uncovering patterns and structures. Chaos Theory is one of the topics in mathematics that, I feel, particularly throws light on the intricacies of the human condition. Chaos Theory shows that even within apparent disorder there can often be found both order and structure. My investigation took me to the earliest ideas on Chaos Theory. In 1961 Edward Lorenz inadvertently discovered the phenomenon of sensitive dependence on initial conditions by noticing the effect of rounding off decimals had in a computer-generated sequence of calculations for weather prediction. This event marked the (re-) discovery of what is now commonly known as Chaos Theory. I decided to visually interpret this phenomenon in my drawings, by using my basic 8-spoke pattern and continuing with multiple iterations using stencils with a small margin of error. The errors accumulate to create these cloud-like, chaos- derived drawings. If the viewer spends a few moments gazing into what at first appears to be a chaotic cloud they will begin to see the pattern of the fractals develop. There is a hidden structure to these drawings, as well as a sense of growth through time. This process of layering iteration on top of iteration takes weeks of work and through the process the drawings go through interesting changes and developments. I wanted a way to incorporate this sense of time and change into my art. It was time to make a movie.

I started with a fresh large black sheet of paper. Then I installed a digital camera over my drawing table. I began my drawing process, but after each line I took a still shot of the drawing. I continued this process over months. I wanted the movie to have an organic handmade feeling to it so I made a number of changes throughout the process. The frequency with which I photographed the drawing fluctuated. Sometimes I would take a picture after each line, sometimes I would complete a small cycle of lines before taking a picture. This change produced skips and jumps in the rhythm. Occasionally, I moved the camera closer to or farther away from the drawing. I also included myself in the photos as the generating mechanism: there are a few shots where you can see my hands. At a point where the drawing was getting quite complicated, I adjusted the camera so you could see my feet coming and going from view: the drawing was becoming a dance. Leaning over to draw and then pulling away to take a picture created a very physical element to this work and I wanted to express that physicality. Thousands of still digital photographs were taken during the drawing process. These photographs were put into consecutive order and then repeated in reverse to create the sense of both growth and decay. The edited product is a 6 minute video titled “Chaos Night”.

I knew from the beginning of the process that I would add music into the final production. I contacted composer Max Schreier, and discussed the structure and mathematics I wanted incorporated into the music. I wanted to make sure the number 8 played a major role in the structure of the music to mirror the 8 spokes of the drawing. Max agreed to write and perform a 6 minute composition based on these specifications. Influenced by Arnold Schoenberg, he based the music on a series of 8 sequential notes. While the bottom voice of the organ plays a drawn out rhythm associated with the first iteration of the drawing, the violin accelerates with the increased speed of the smaller iterations. The right hand of the organ creates small disturbances, each catalyzed by the random insertions of hands, feet and rulers in the video.

– Susan Happersett

Originally presented at Bridges Art Exhibition – Banff, Canada – July 2009;

Fibonacci Circle Curves

“How does an artist take inspiration from a Mathematical concept and transform it into a work of art?”

This is a question people have asked me many times. Each artist follows her own path, but translating the aesthetic elements of a mathematical topic into the visual realm of Art is my personal journey. I will discuss the process I developed to to create my most recent series of drawings, which I refer to as “Fibonacci Circle Curves”. I will map the artistic process from my selecting a Mathematical theme, through the many steps it takes to complete a drawing. This is a process that took 18 months to develop.

Through the years I have made many drawings exploring the Fibonacci Sequence. The recursive nature of the sequence makes it an interesting subject for abstract drawing. My new series of drawings investigates the visual qualities of intersecting circles whose area measurements are in proportions related to the Fibonacci Sequence. This experiment is a different way to look at the ratios of consecutive Fibonacci numbers.

EPSON MFP image

The measurement of the area of the first circle in the sequence determines the area of each subsequent circle.The measurement of the area of the second circle is the same as that of the first circle. The measurement of the area of the third circle is twice the first. The measurement of the area of the fourth circle is three times the first. The measurement of the area of the fifth circle is five times the first, etc. This series of circles illustrates the Fibonacci Sequence: 1,1,2,3,5,8…, though  the measurements of their areas.

EPSON MFP image

I made templates for the first eight circles in the series and started to experiment. I started off by drawing the circles in a straight line. I drew the first circle and marked  its center point. then I began the second circle at that center point. Then each subsequent circle started at the center point of its predecessor. In this format it is possible to draw a straight line connecting the center points of each of the circles. I immediately noticed there were some aesthetically interesting shapes created by the intersecting circles, but I was not satisfied. I decided to continue to manipulate the circles. I broke up the straight line connecting the center points into angled line segments. Instead of having the center points of the circles line up, the line segments connecting the center points should create angles less than 180 degrees. After some time it became clear that the best angle to use was the Golden Angle. The golden angle has a measurement of approximately 137.51 degrees. It is the smaller of the two angles formed by two radii that divide the circumference of a circle into two arcs so that the ratio of the measurement of the large arc to the small arc is equal to the ratio of the  measurement  of the total circumference to the measurement of the larger arc.

EPSON MFP image

After curving the series of circles, the space created between the arcs started to look much more interesting. I was still not satisfied with the image, however. I began a process of using this curve as my basic building block. I made a number of curves on transparent paper and I began to superimpose and shift the images. I did not want the drawing to look static but wanted the image to have a sense of movement. I came up with a method of drawing using the line segments created by connecting the center points of adjacent circles. Using these line segments as a guide, I dragged the template of the first circle, so that the center point stayed on the guideline. Then I drew multiple circles until the first circle was completely inside the second circle, sharing one circumference point. I repeated this with each of the circle templates. The finished product was finally an image with potential.

EPSON MFP image

This elegant structural unit is the starting point for all of this new work. I have made numerous drawings using multiple Fibonacci circle curves. either shifted or rotated or, and superimposed on top of each other, creating some surprising interactions. I continue to explore the shapes produced through this process. I have made work emphasizing the negative spaces, painstakingly filling in between the lines. By cutting up the drawings and rearranging the sections I have made collages and Artist’s books allowing the viewer to focus on small sections of the curve.

Fibonacci Circle Curve Red

Fibonacci Circle Curve Red

I hope this detailed explanation of my artistic practice offers an interesting behind-the-scenes tour of my process, beginning with my thinking about Fibonacci ratios and circles, and progressing through experiments leading to new drawings.

– FibonacciSusan

More from the JMM exhibition

A few days ago, I discussed a few of the artists exhibiting at the art show that was part of the Joint Mathematics Meeting in Baltimore. Here are my other favorites from that show.

Robert Fathauer

I have been a fan of Robert Fathauer‘s sculptures for years, but I feel Three-Fold Development is one of his best works. This ceramic vessel has a top lip sculpted to depict the development of a fractal curve through five iterations. Starting with a circle, then a three-lobed curve, then a nine-lobed curve. In each subsequent iteration the number of lobes triples.The sculpture has a wonderful organic quality, while still maintaining an elegant complexity. Fathauer has skillfully kept the spacing quite even between the ribbons of clay creating a graceful relationship between the positive and negative space.

Image

Fathauer – Three-Fold Development – Ceramic

Margaret Kepner

Mathematics enthusiasts have been fascinated with Magic Squares for centuries. Magic Squares are grids. Each grid square contains a number. The grids are constructed so that the sum of the numbers in each column, row and diagonal of the square are equal. Margaret Kepner‘s Archival Inkjet print “Magic Square 8 Study: A Breeze over Gwalior” is a an intriguing representation of a Gwalior Square: an 8 by 8 magic square which contains the numbers 0 to 63. The sums of the rows, columns and diagonals all  add up to 252. Kepner has translated each of the numbers 0 to 63 into graphic patterns using her own system, and formatting the numbers in either base 2 or base 4. The resulting print has a great optical effect of patterned color block grids that are both horizontal, vertical and across the diagonal. It reminds me of a Modernist quilt or a contemporary twist on some of Al Jensen’s paintings that resemble game boards. Kemper refers to her artistic process as “visual expression of systems”. I think that this print goes beyond merely expressing the Gwalior Square it celebrates the Mathematics in a bold field of shape and color.

photo-1

Kepner – Magic Square 8 Study: A Breeze over Gwalior – Inkjet print

Petronio Bendito

At the Art Exhibition at the JMM conference quite a bit of the art was digital printing on paper. Petronio Bendito – in contrast – prints his work on canvas, giving the prints more of a painterly feel. Bendito has developed algorithms to define his color palette, but there is also an element artistic expression in establishing the final images.”Color Code, Algorithmic lines n.0078″ is so vibrant that it beckoned me from across the room. Bendiito’s use of color and line creates  a cacophony of bright straight and curved thin ribbons of paint. The use of  the black background makes the exuberant frenzy of color jump out to the viewer.

photo

Bendito – Color Code, Algorithmic lines n.0078 – Digital print on canvas

Lilian Boloney

Lilian Boloney is a textile artist who uses crocheting to explore the geometry of hyperbolic figures.There is an elegant simplicity to the off-white cotton thread she used to crochet the sculpture “Boy’s surface”. This allows the viewer to explore the complex topology of the figure with out the distraction of patterns or color. Boloney not only has a clear understanding of her Mathematical subject, but she transposes their beauty into graceful objects. Instead of models of Hyperbolic figures I see them crocheted portraits.

photo

Boloney – Boy’s surface – Crocheted cotton

I hope you enjoyed the samples of work from the JMM exhibition as much as I did. The Art Exhibition at the JMM conference was organized by the Bridges Organization, an international organization that promotes the relationship between Art and Mathematics. Each year they have a conference where Mathematicians, Artists and educators meet to discuss, explore and learn about Math Art.

This year’s Bridges 2014 conference will take place in August in Seoul, South Korea. This is the first Bridges conference to take place in Asia. It is a wonderful opportunity. I encourage all artists who are interested in Mathematics to attend and participate at this conference. The deadlines for paper and art submissions are fast approaching all info is on the Bridges website.

-FibonacciSusan

Mathematical Art

In this blog, I will be sharing my observations on Mathematical Art that I see in galleries museums exhibitions and art fairs. What is Mathematical Art? I will choose work that meets at least one of the following three criteria: The art

  1. is based on a Mathematical phenomenon, or
  2. it is generated by a Mathematical process, or
  3. it is a personal response to Mathematics by the artist.

JMM – Baltimore 2014

Each year in January, thousands of Mathematicians gather at the Joint Mathematics Meeting (JMM) to discuss current issues in their field.  For the past 11 years, an exhibition of Mathematical Art has been part of the event. This year the Joint Meeting was held in Baltimore at the convention center. The art exhibition was held at one side of the general exhibition hall.

Image

Joint Mathematical Meeting – 2014 Art Exhibition

I have participated in the exhibition five times in the past six years and over that time the exhibition has matured, both in the range of work exhibited, and in the quantity of interesting – or even exciting – work.

Exhibitions like this are really a mixed bag of prints, drawings, paintings and sculpture of all types. You can find full catalogs of the shows online. here I will discuss just a few of my favorites from this year’s show.

Shanti Chadrasekar

Kolam-93X93 is a painting on canvas based on the fractal patterns of Kolam drawings. Shanthi Chadrasekar has incorporated the rules of Indian Kolam drawings into her artistic practice. Kolam drawings are traditionally drawn by women, each day, at the entrance of their homes. In this painting, Chandrasekar has created an elaborate 93 by 93 dot grid with a single thread-like line that gracefully winds around each dot, completely enclosing the dots in a web. I find the intricacy of this painting mesmerizing. Spending a few moments with this work, the viewer feels as though they too could be encircled by this unbroken thread. The patterning on this painting is so dense that a small image of the entire piece will not do justice to the work so I am providing just a close up of a small section.

Chandrasekar - Kolan 93X93 - Paint on Canvas - 24" x 24" (detail)

Chandrasekar – Kolan 93X93 – Paint on Canvas – 24″ x 24″ (detail)

Karl Kattchee

Karl Kattchee has developed a unique process to use Mathematics to create his digital prints. His work starts with hand drawn abstract drawings that are then multiplied and manipulated using  a camera, a computer and a printer. He creates reflections, translations, etc. until the image appears to have fallen into chaos. Kattchee then builds patterns using these chaotic elements. What I find very interesting about these prints is that the whole process begins with what  Kattchee refers to as” abstract automatic drawings”. The freedom of this stream-of-consciousness type of drawing lends a whimsical quality to the initial pictures. After they have been subjected to all of the technical process, they retain a playful quality: the drawings dance across the page.

photo32

Karl Kattchee

More about the art exhibition at JMM in Baltimore next time.

– FibonacciSusan